Numbers and charts, graphs and tables. People often think of data as strictly a numbers game. But what if we told you your donor data is more than that?
Much like your favorite novel, data reveals a narrative, communicating insights and visuals that can influence and drive change.
Do you understand the story your donor data is telling?
A DATA STORY
Too often, data storytelling is interpreted as just visualizing data effectively. But it’s so much more than pretty graphs and charts.
Data storytelling is a structured approach for communicating data insights, and it involves three key elements: data, visuals and narratives.
When you couple data with a narrative, it helps explain to your audience what’s happening in the data and why an insight is important. Stories are 22 times more memorable than facts alone, so finding a compelling narrative to pair with your data is important.
Don’t worry, the pretty graphs and charts aren’t getting the boot. When we apply visuals to the data, they can enlighten the audience to insights they wouldn’t see otherwise.
When you combine the right visuals with the right data, you have a data story that can influence and drive change.
THE BIG PICTURE
There are three strategies to help you better understand your donor data story: win, lift and keep. By winning more donors, lifting the performance of the donors you already have, and keeping more of your current donors, your revenue will continue to grow.
We’ve taken it even further and broken down which metrics you should be tracking for each strategy.
WIN
Bringing in more donors is a common goal that all nonprofits share. But how are you going to do it? Changing your ask string or reactivating lapsed donors are great places to start.
But to understand if you are actually winning more donors, there are a few metrics you should be tracking:
- Number of donors acquired
- Number of lapsed donors reactivated
- New donor gift size
- Percent acquired by value
- Lapsed reactivated donors by recency
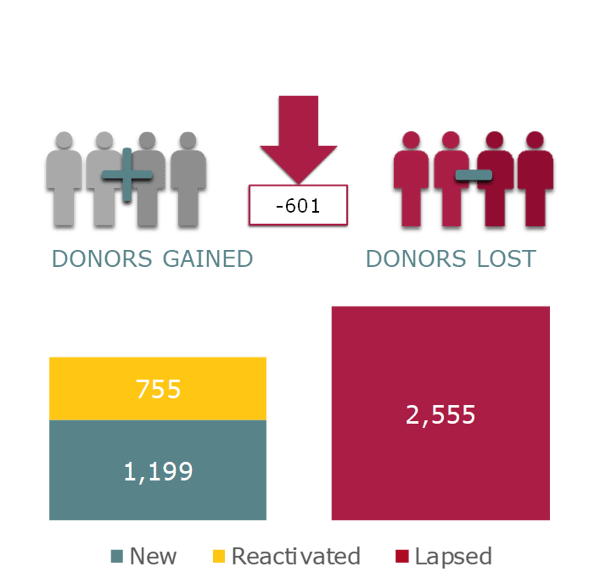
As you can see in the chart, although this organization brought in new and reactivated donors, they’re still letting too many lapse – resulting in an overall loss at the end of the year.
LIFT
How can you be sure if you’re successfully lifting the performance of the donors you already have? Look at these key metrics:
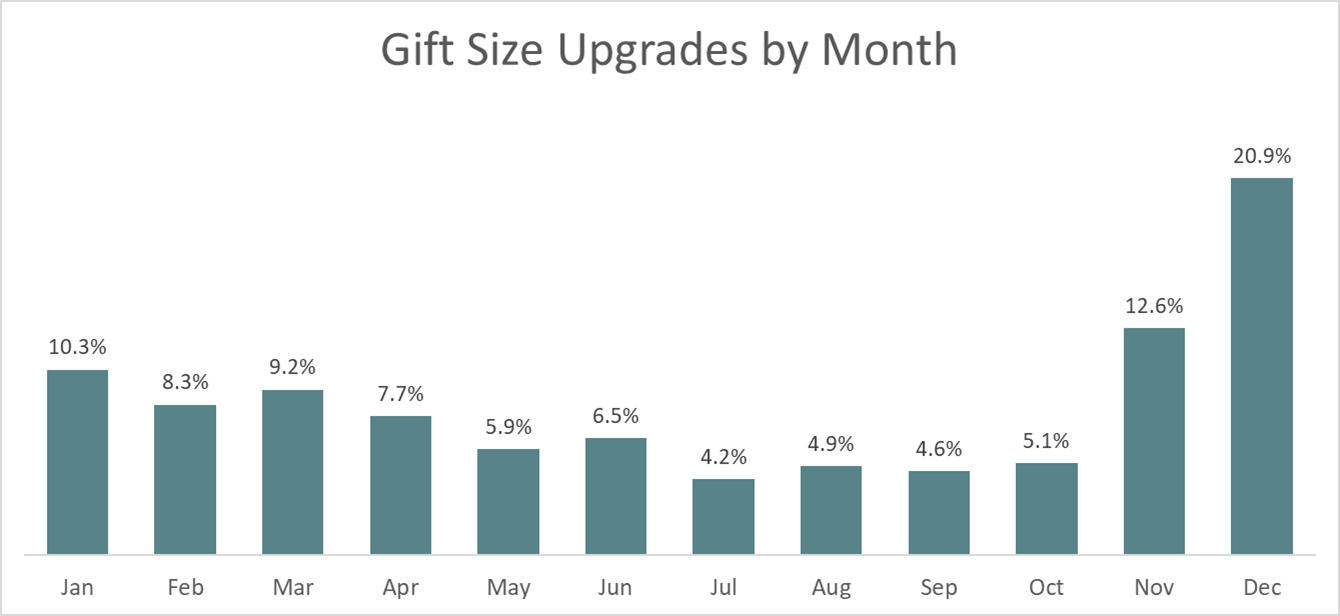
- Average gift size
- Gift frequency
- Upgrade
- Upgrade to major donor level
- Count of sustaining donors
Not surprisingly, most gift size upgrades happen during the holiday season. Consider your strategy for asking for larger gifts during this time of year.
Another way to lift donors is through a mid-level donor strategy that includes a monthly communication strategy.
KEEP
Retention, retention, retention. Track your keep rate with these metrics:
- Retention rate
- Retention rate by lifecycle
- Retention rate by donor value
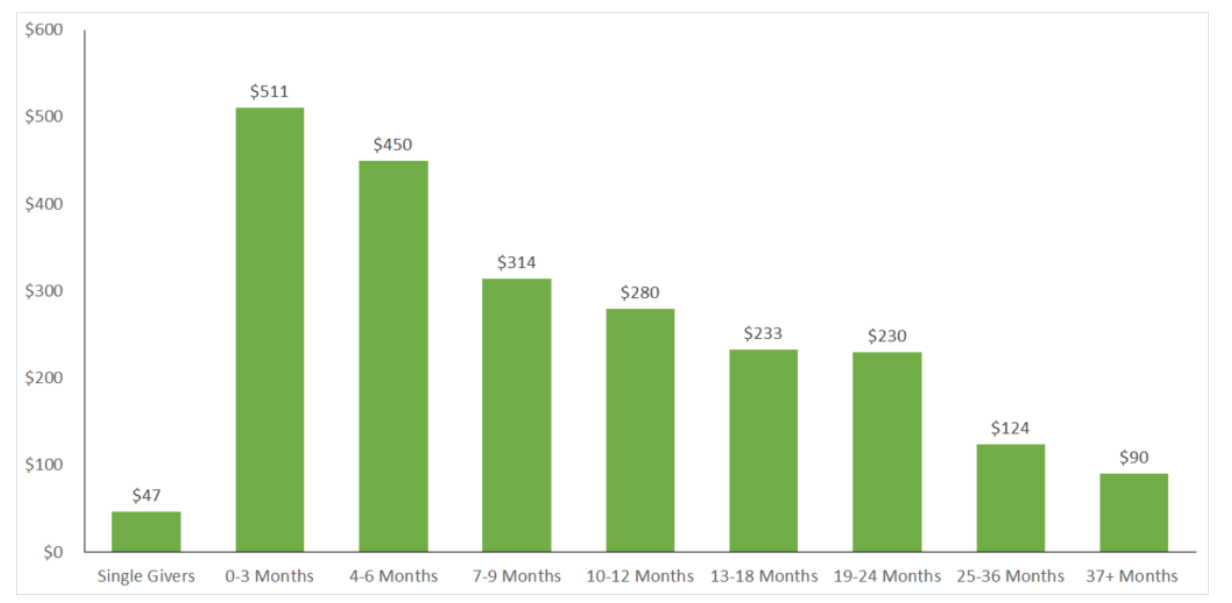
We’ve said it before, and we’ll say it again: Donors want to feel connected to the organizations they’re giving to. Ultimately, the best way to drive revenue is to retain your current donors.
New donors who give a second gift within the first three months have a long-term value nearly twice as high as those who give at the 12-month mark.
This indicates the need to have strategies in place encouraging the second gift as soon as possible for your new donors.
Do you have a strong welcome series for new donors? Do you send out personal touches such as handwritten cards, thank-you calls and impact pieces regularly?
These are powerful strategies when it comes to retention, and you’d be surprised how far showing a little gratitude can get you.
5-YEAR REVENUE FORECAST

HOW DO YOU WANT YOUR STORY TO END?
In the chart above, the baseline projections are based on all metrics and number of new donors remaining the same at FY18 levels over the next five years. The strategic growth projections are based on bringing up the number of donors acquired to 3,000 per year, increasing retention rate of multiyear donors and bringing up the average gift in all life cycles.
By understanding the story your data is telling, you can make sure that baseline isn’t your future.


Leave a comment: